ŚģČŤ£Ö Xdebug ŚĻ∂šłĒśé•ŚÖ•PhpStorm
ŚģČŤ£Ö Xdebug ŚĻ∂šłĒśé•ŚÖ•PhpStorm
ŚģČŤ£Ö
šłčŤĹĹxdebugśĖĻś≥ē1Ôľö
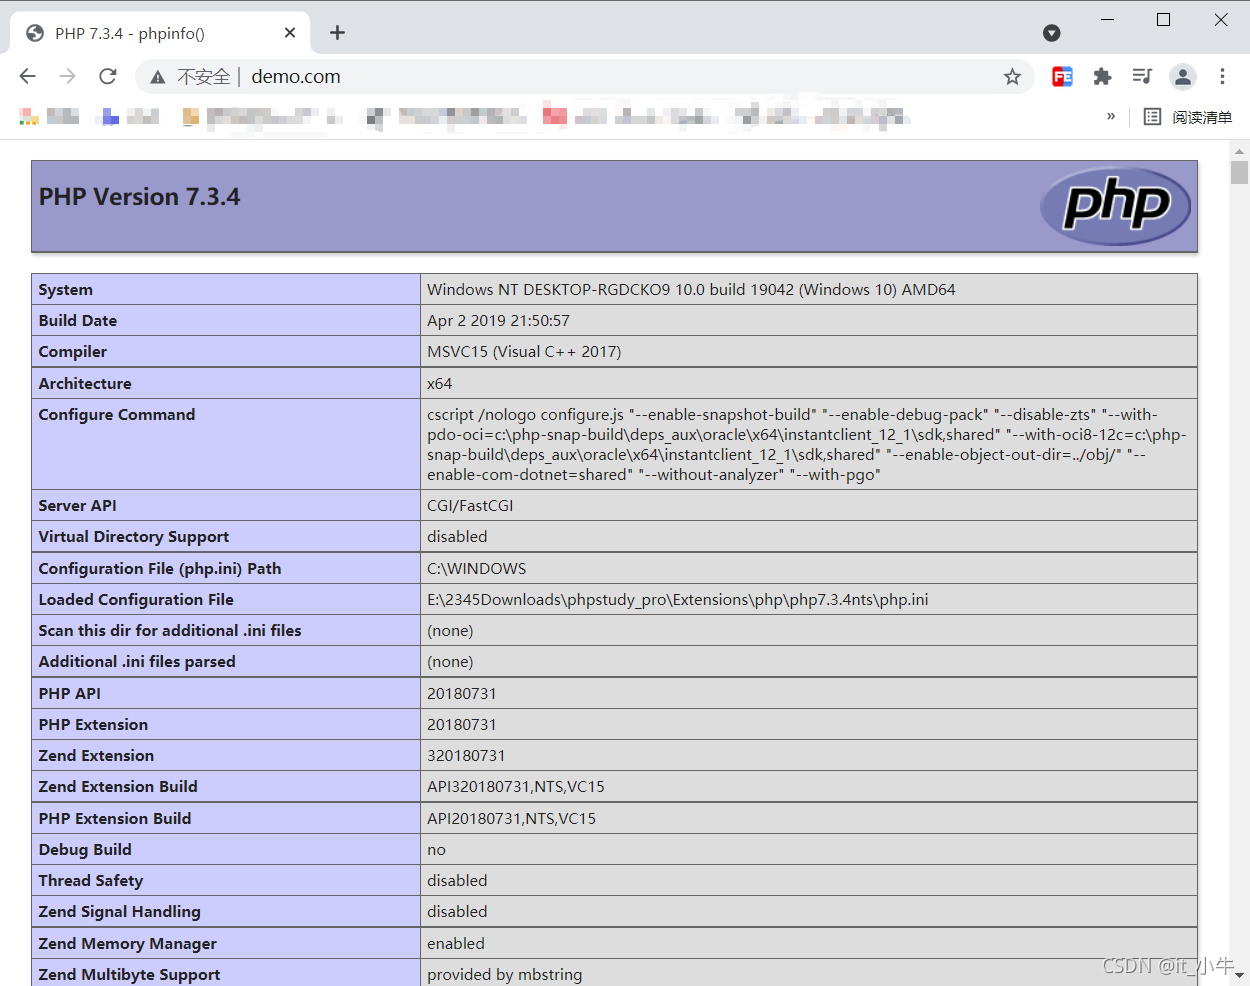
1„ÄĀśČÄphpinfoÔľõ
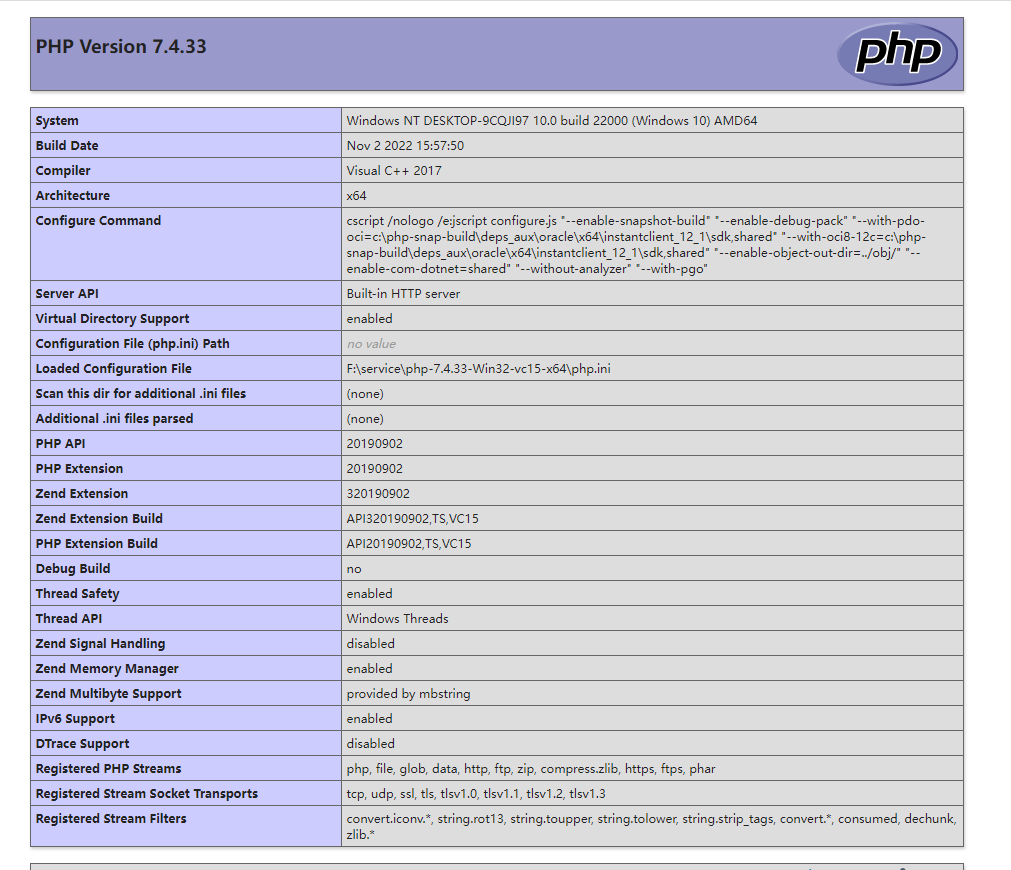
ÁļĘś°ÜťáĆÁöĄťÉĹśėĮšłčŤĹĹśó∂ťúÄŤ¶Āś≥®śĄŹÁöĄšŅ°śĀĮÔľõ
2„ÄĀśČÄxdebugŚģėÁĹĎŚĻ∂ŤŅõŚÖ•šłčŤĹĹť°ĶťĚĘšłčŤĹĹ

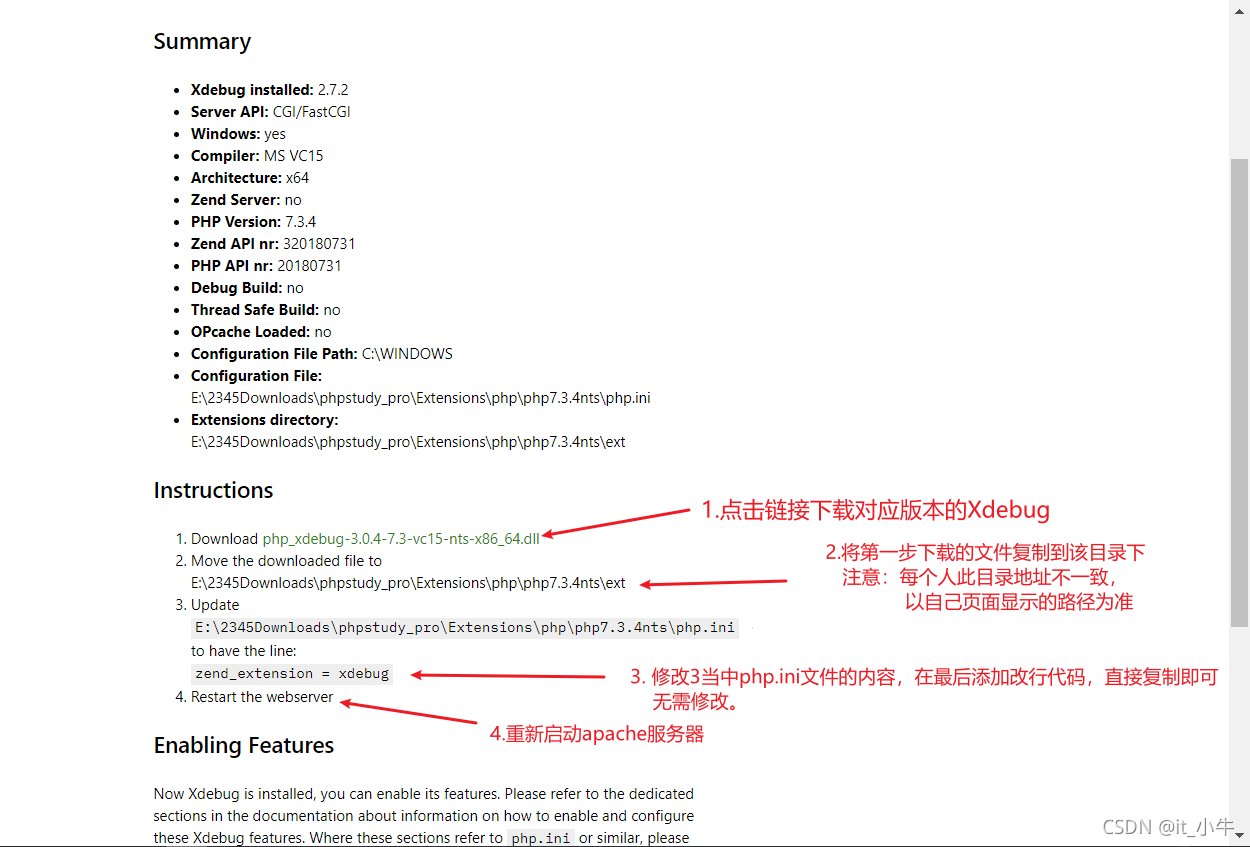
ŤŅôśó∂ŚŹĮšĽ•śĆČÁÖßšłäťĚĘÁöĄphpinfošŅ°śĀĮŤŅõŤ°ĆŚĮĻŚļĒÁöĄšłčŤĹĹԾƌ¶āphp7.3ÔľĆVC5ÔľĆntsťĚěÁļŅÁ®čŚģČŚÖ®ŚíĆÁĒĶŤĄĎśėĮ64šĹćŤŅėśėĮ32šĹćÁ≥ĽÁĽü„Äā
šłčŤĹĹxdebugśĖĻś≥ē2Ôľö
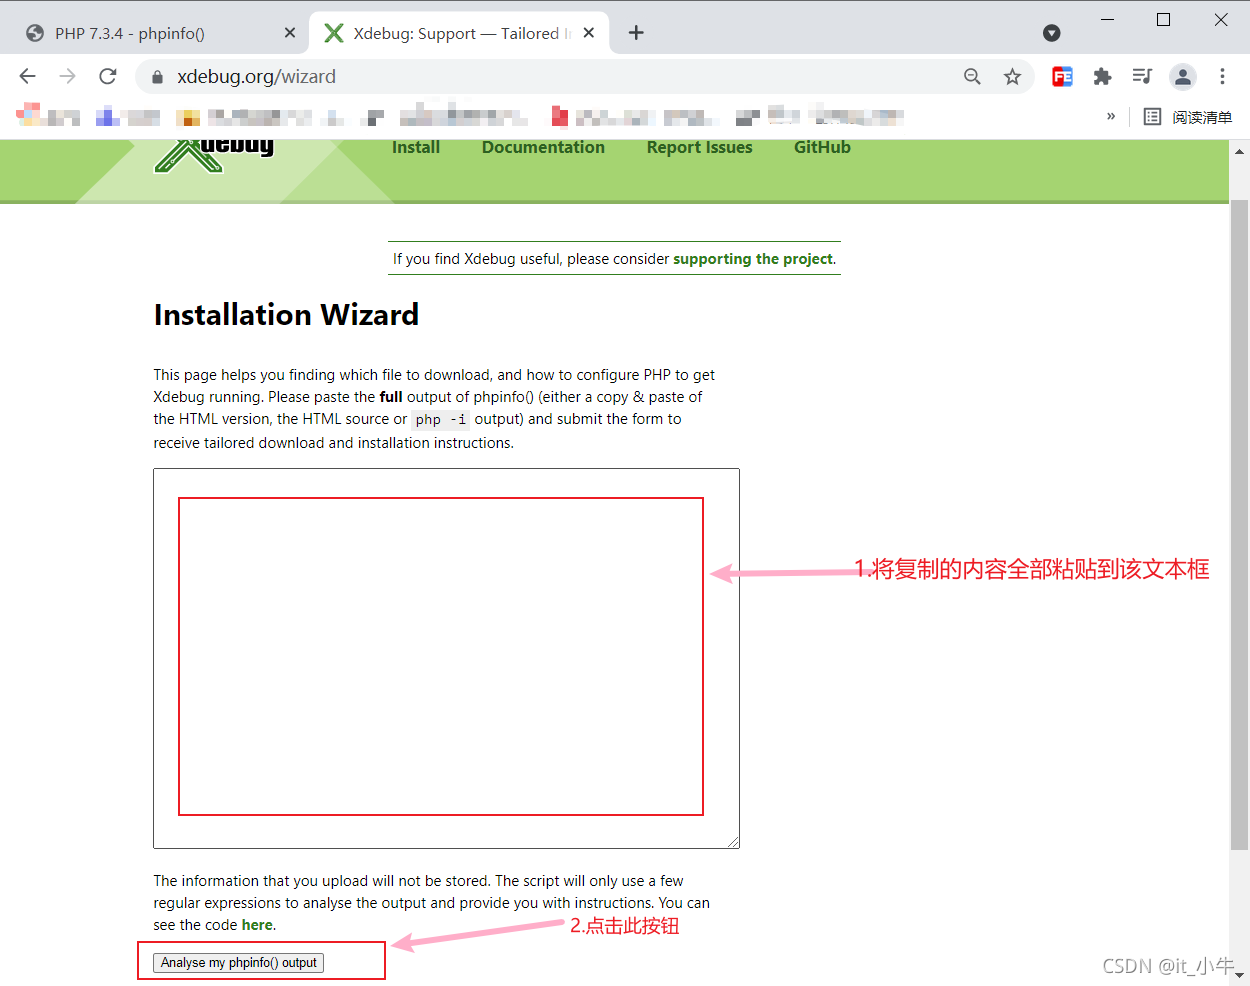
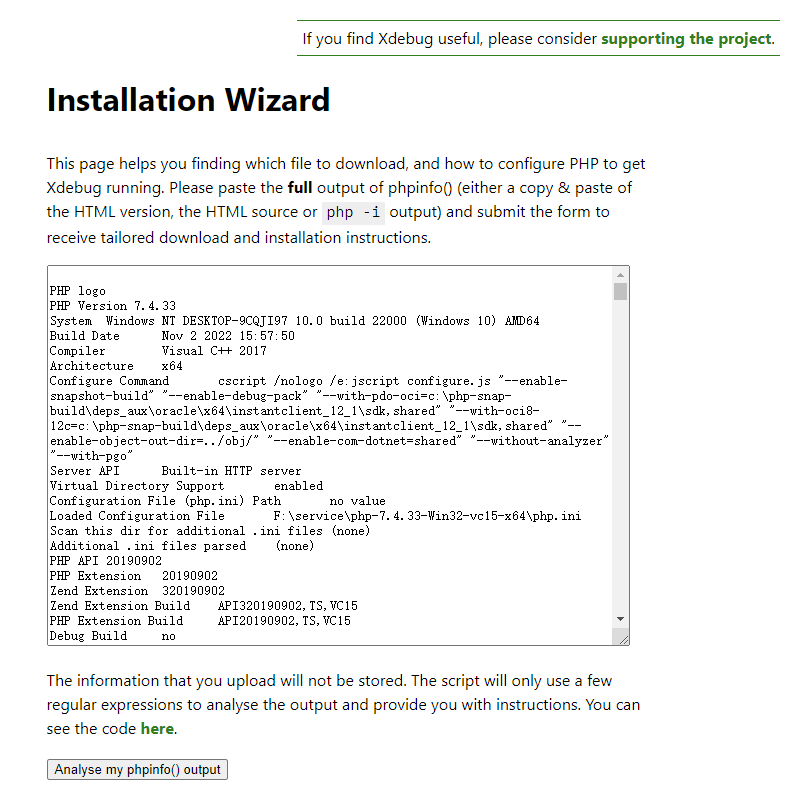
śČÄhttps://xdebug.org/wizard.phpŤŅôšł™ÁĹĎÁęôԾƌ§ćŚą∂phpinfoÁöĄśČÄśúČšŅ°śĀĮŚĻ∂Á≤ėŤīīŚąįť°ĶťĚĘšł≠Ծƌ¶āŚõĺÔľö

ÁāĻŚáĽšłčŤĹĹxdebug

šļĆ„ÄĀťÖćÁĹģphp.iniśĖᚼ∂ÁöĄxdebugŚŹāśēį
1„ÄĀśČČĮĻŚļĒphpÁČąśú¨ÁöĄphp.iniԾƌú®śĖᚼ∂šł≠Śä†šłäxdebugťÖćÁĹģšŅ°śĀĮ
[xdebug]
;śääxdebugśĖᚼ∂śĒĺŚú®ŚĮĻŚļĒÁöĄphpÁČąśú¨śĖᚼ∂šłč
zend_extension ="E:/SORF/phpstudy_pro/Extensions/php/php7.3.4nts/php_xdebug-2.8.0-7.3-vc15-nts-x86_64.dll"
xdebug.remote_enable = On
;ŚźĮÁĒ®śÄߍÉĹś£ÄśĶ茹ܜěź
xdebug.profiler_enable = On
;ŚźĮÁĒ®šĽ£Á†ĀŤá™Śä®Ť∑üŤł™
xdebug.auto_trace=On
;ŚÖĀŤģłśĒ∂ťõÜŚáĹśēįŤįÉÁĒ®ÁöĄŤŅĒŚõěŚÄľ
xdebug.collect_return=On
xdebug.profiler_enable_trigger = On
xdebug.profiler_output_name = cachegrind.out.%t.%p
;śĆáŚģöśÄߍÉĹŚąÜśěźśĖᚼ∂ÁöĄŚ≠ėśĒĺÁõģŚĹē
xdebug.profiler_output_dir ="E:/SORF/phpstudy_pro/Extensions/tmp/Xdebug"
xdebug.trace_output_dir = "E:/SORF/phpstudy_pro/Extensions/tmp/Xdebug"
xdebug.profiler_output_dir = "E:/SORF/phpstudy_pro/Extensions/tmp/Xdebug"
xdebug.show_local_vars=0
xdebug.idkey="PHPSTORM"
xdebug.var_display_max_depth=10
;ťÖćÁĹģÁęĮŚŹ£ŚíĆÁõĎŚź¨ÁöĄŚüüŚźć
xdebug.remote_port=9100
xdebug.remote_handler=dbgp
xdebug.remote_host="127.0.0.1"
2„ÄĀśä•Ś≠ėśĖᚼ∂ŚĻ∂ťá挟ĮśúćŚä°
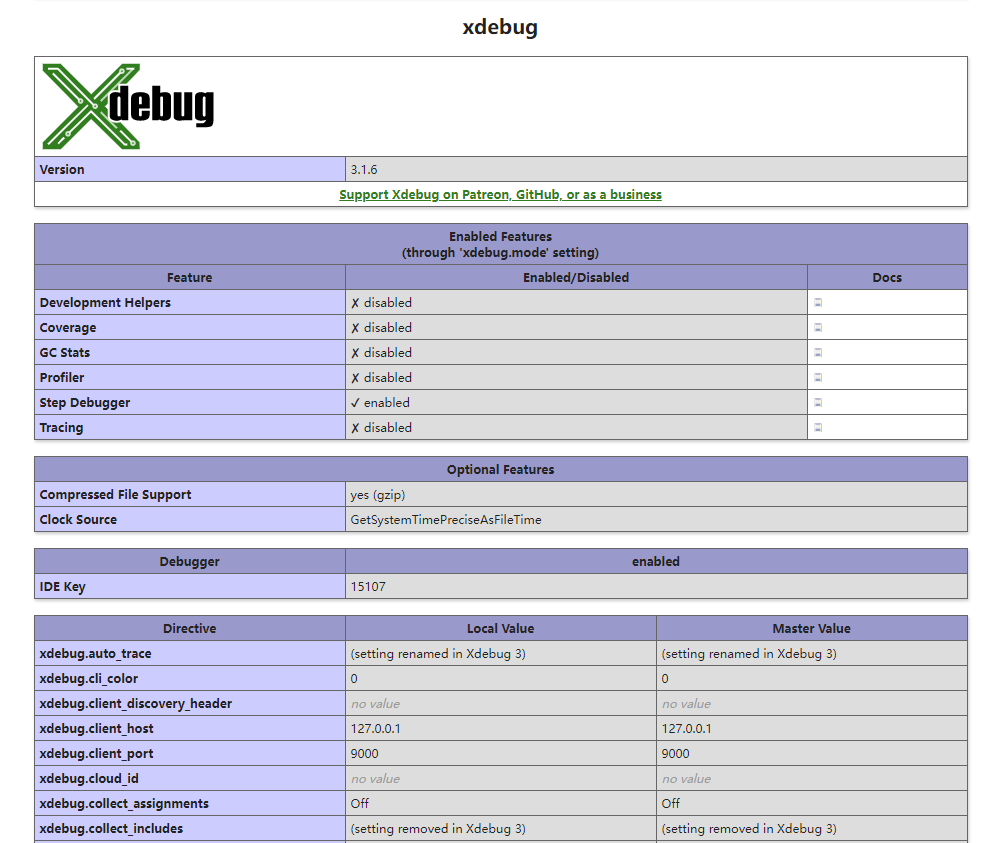
śČÄphpinfoŤÉĹÁú茹įšłčťĚĘŚįĪŤ°®Á§ļxdebugśČ©ŚĪēŚģČŤ£ÖśąźŚäüšļÜ
šłČ„ÄĀphpstromťÖćÁĹģ
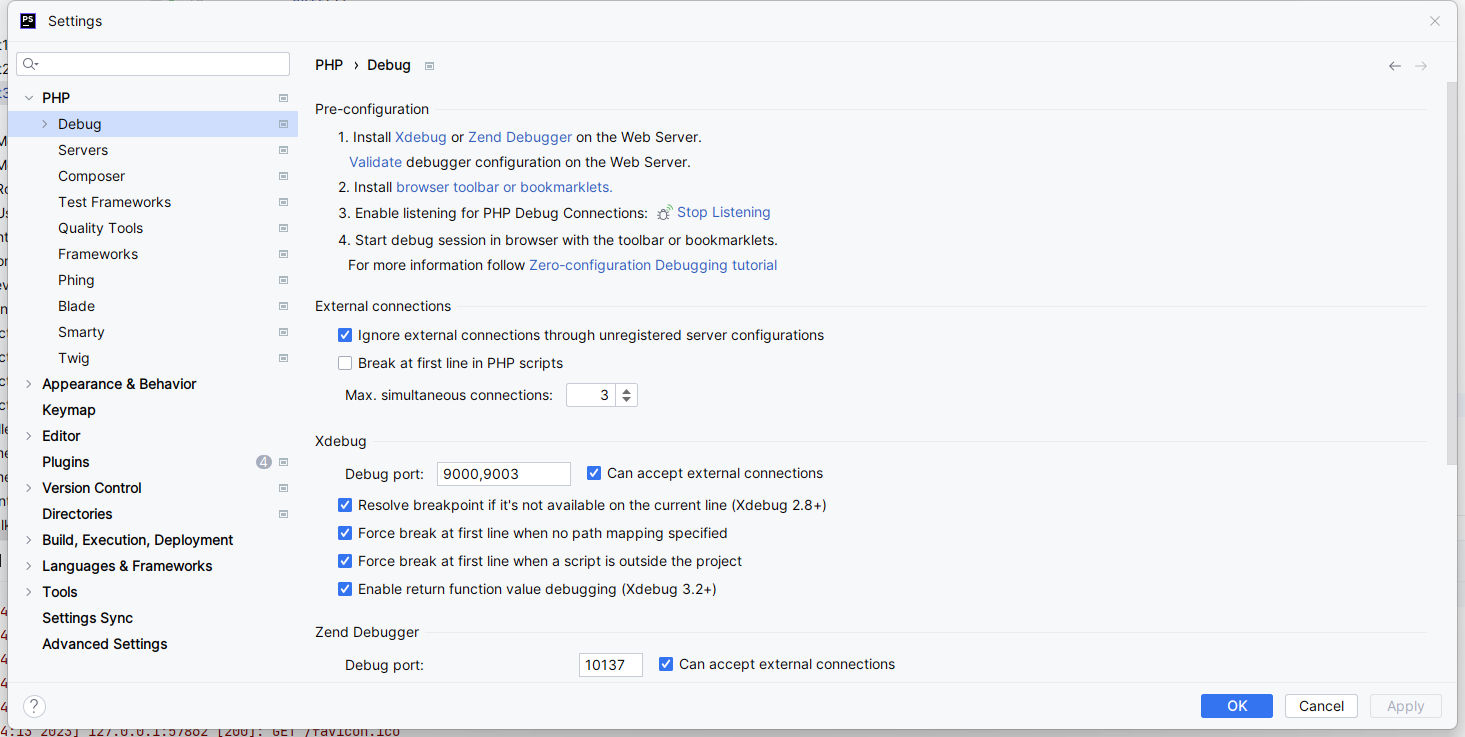
śČÄphpstorm->file/śĖᚼ∂->setting/ŤģĺÁĹģÔľĆÁĄ∂ŚźéŚ¶āŚõĺśďćšĹú
ÁĽßÁĽ≠Ś°ęŚÜôxdebugšĽ£ÁźÜ
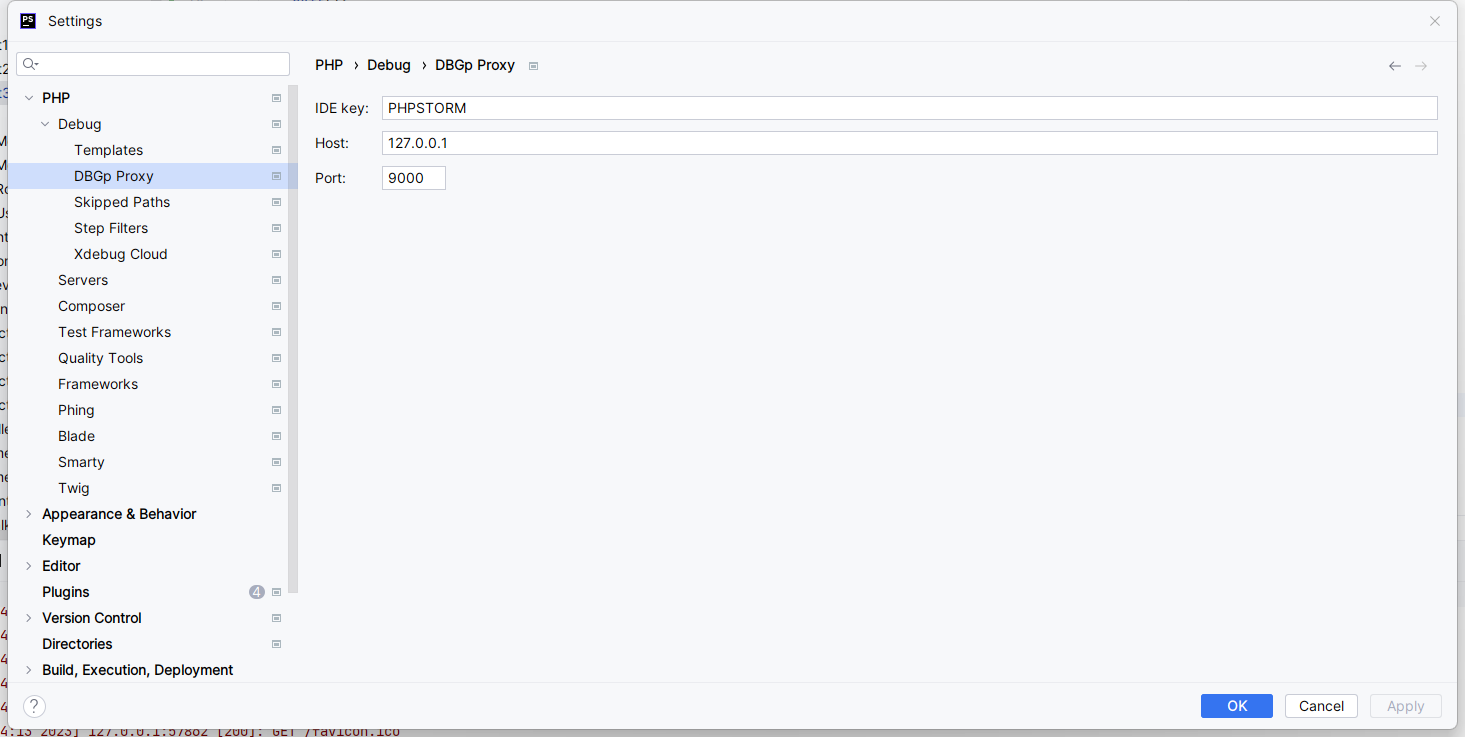
Ś°ęŚ•ĹŚźéÁāĻŚáĽŚļĒÁĒ®ÔľĆŚÜćÁāĻŚáĽÁ°ģŚģö

Śõõ„ÄĀšłļť°ĻÁõģťÖćÁĹģdebug
1„ÄĀŚŹ≥šłäŤßí
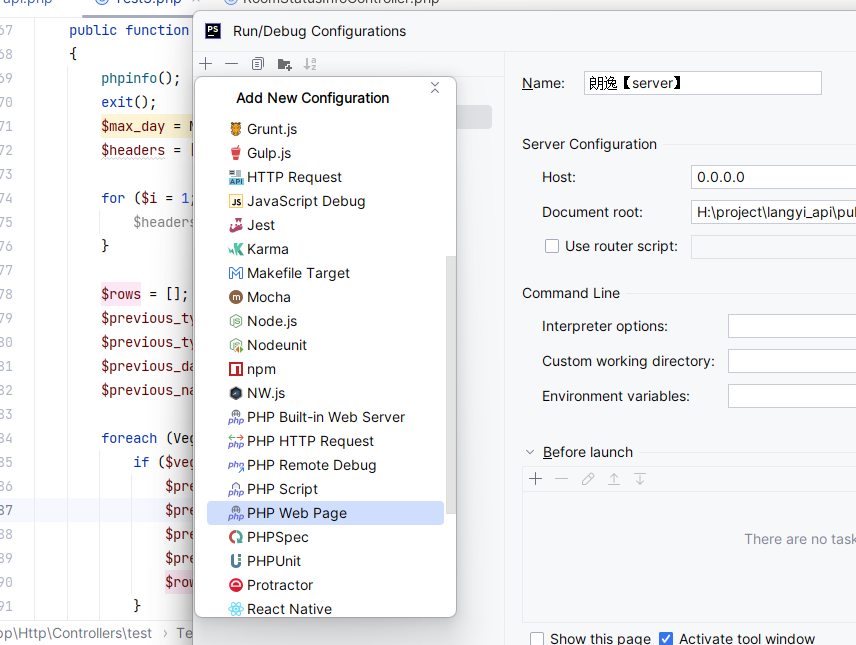
2„ÄĀťÄČśč©PHP Web Page
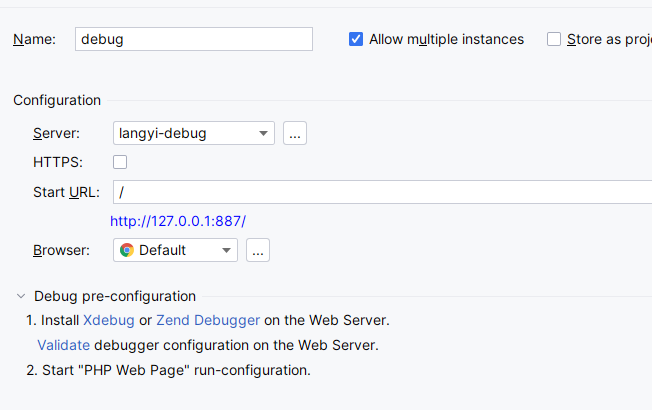
3„ÄĀPHP Web Pageť°ĶťĚĘ
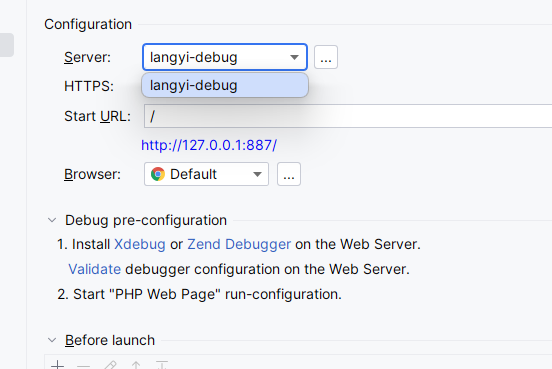
4„ÄĀ

postman
ś∑ĽŚä†cookie XDEBUG_SESSION=PHPSTORM;
šļĒ„ÄĀŤįÉŤĮē

Śú®ťúÄŤ¶ĀŤįÉŤĮēÁöĄŚúįśĖĻśČďśĖ≠ÁāĻ

ŚľÄŚßčŤįÉŤĮē

ŚģČŤ£ÖŚ•ĹŚźéŚŹĎÁéįšłÄšł™ťóģťĘėԾƌģČŤ£ÖxdebugťĚ쌳łŚĹĪŚďćÁ≥ĽÁĽüśÄߍÉĹԾƌéüśĚ•Śá†ÁßíśČÄÁöĄť°ĶťĚĘԾƌģČŤ£ÖŚźéŚŹĮŤÉĹťúÄŤ¶ĀŚćĀŚá†ÁßíÁĒöŤá≥śõīŚ§öÁöĄśó∂ťóīśČĄÄā
ŚģČŤ£ÖśĖĻŚľŹ2
šłÄ„ÄĀšĽÄšĻąśėĮXdebug
šĹúšłļÁ®čŚļŹŚĎėԾƌú®ŚľÄŚŹĎŤŅáÁ®čšł≠ԾƍįÉŤĮēśėĮšłÄŚģöšľöÁĽŹŚéÜÁöĄŤŅáÁ®čÔľĆXdebugśėĮšłÄšł™ŚľÄśĒĺśļźšĽ£Á†ĀÁöĄPHPÁ®čŚļŹŤįÉŤĮēŚô®ÔľĆŚŹĮšĽ•ŚłģŚä©ŚľÄŚŹĎšļļŚĎėŤŅĹŤł™„ÄĀŤįÉŤĮēŚíĆŚąÜśěźPHPÁ®čŚļŹÁöĄŤŅźŤ°ĆÁä∂ŚÜĶ„Äā
šļĆ„ÄĀŚģČŤ£Öś≠•ť™§
Ťé∑ŚŹĖŚĻ∂ŚģČŤ£ÖťÖćÁĹģXdebug
XdebugŚíĆŚĹďŚČćšĹŅÁĒ®ÁöĄPHPÁéĮŚĘÉÁČąśú¨śúČŚĮÜŚąáÁöĄŚÖ≥Á≥ĽÔľĆŚú®šłčŤĹĹśó∂ťúÄŤ¶ĀťÄČśč©šłéšĻčŚĮĻŚļĒÁöĄÁČąśú¨„ÄāŚú®ťÄČśč©ÁČąśú¨śó∂ŚŹĮšĽ•ŚÄüŚä©XdebugŚģėśĖĻśŹźšĺõÁöĄšłÄšł™ś£ÄśĶčŚ∑•ŚÖ∑śĚ•ŚŅęść∑ŚúįťÄČśč©ŚźąťÄāÁöĄÁČąśú¨„Äā
ś£ÄśĶčPHPÁéĮŚĘÉšŅ°śĀĮ„ÄāŚú®śú¨ŚúįÁęôÁāĻšł≠śĖįŚĽļšłÄšł™ŚźéÁľÄšłļ .php śĖᚼ∂Ծƌú®ŤĮ•śĖᚼ∂šł≠ŤĺďŚÖ•šĽ•šłčšĽ£Á†ĀÔľö
<?php
echo phpinfo();
?>ŚąÜśěźÁČąśú¨šŅ°śĀĮ„ÄāŤŅźŤ°ĆšłäťĚĘÁöĄ .php śĖᚼ∂ԾƜĖᚼ∂ÁĽďśěúŚ¶āšłäŚõĺԾƌ֮ťÄČŚ§ćŚą∂ŤĮ•ť°ĶťĚĘšł≠ÁöĄśČÄśúČšŅ°śĀĮ„ÄāŚú®śĶŹŤßąŚô®šł≠ŤģŅťóģŤĮ•ťďĺśé•https://xdebug.org/wizardԾƌįÜšĻčŚČ挧挹∂ÁöĄšŅ°śĀĮÁ≤ėŤīīŚąįšłčŚõĺśČÄÁ§ļÁöĄśĖáśú¨ś°Üšł≠ÔľĆÁĄ∂ŚźéŚćēŚáĽÁļĘŤČ≤śĖĻś°Üšł≠ÁöĄśĆČťíģ„Äā
XdebugŚģėÁĹĎšľöŤá™Śä®ŚąÜśěźśŹźšļ§ÁöĄPHP ÁéĮŚĘÉšŅ°śĀĮŚĻ∂ÁĽôŚáļšłčŤĹĹťďĺśé•ÔľĆśĆČÁÖßÁĽôŚáļÁöĄśŹźÁ§ļšŅ°śĀĮŤŅõŤ°ĆšłčŤĹĹŚć≥ŚŹĮ„ÄāśŹźÁ§ļšŅ°śĀĮŚ¶āšłčÔľö
ŤŅõŤ°ĆšłäťĚĘÁöĄťÖćÁĹģś≠•ť™§ ÔľĆÁĄ∂Śźéś£Äśü•śėĮŚź¶ŚģČŤ£ÖśąźŚäü„ÄāťáćśĖįŤŅźŤ°ĆÁ¨¨šłÄś≠•šł≠ŚąõŚĽļÁöĄ .php śĖᚼ∂Ծƌ¶āśěúŤŅĒŚõěšŅ°śĀĮšł≠ŚĆÖŚźęšłčŚõĺśČÄÁ§ļÁöĄxdebugÁõłŚÖ≥šŅ°śĀĮԾƌąôŤĮīśėéŚģČŤ£ÖśąźŚäü„Äā
Śú®phpStormšł≠šĹŅÁĒ®Xdebug
1ԾȚŅģśĒĻťÖćÁĹģšŅ°śĀĮ„ÄāÁľĖŤĺĎ E:\2345Downloads\phpstudy_pro\Extensions\php\php7.3.4nts\php.ini śĖᚼ∂ԾƌĘěŚä†Ś¶āšłčŤįÉŤĮēťÖćÁĹģšŅ°śĀĮŚĻ∂ťá挟ĮApacheśúćŚä°ÔľąŤ∑ĮŚĺĄšŅ°śĀĮś†ĻśćģŚģěťôÖśÉÖŚÜĶŚĀöŤįÉśēīԾȄÄā
xdebug.profiler_append = 0
;śēąŤÉĹś£ÄśĶčÁöĄŤģĺÁĹģŚľÄŚÖ≥
xdebug.profiler_enable = 1
xdebug.profiler_enable_trigger = 0
;profiler_enable ŤģĺÁĹģšłļ1ÁöĄśó∂ŚÄôԾƜēąŤÉĹÁõĎśĶčšŅ°śĀĮŚÜôŚÖ•śĖᚼ∂śČÄŚú®ÁöĄÁõģŚĹēԾƌŹĮšĽ•Ťá™ŚģöšĻČ
xdebug.profiler_output_dir = "E:\PHP\phpstudy_pro\tmp\xdebug"
;ŤģĺÁĹģÁöĄŚáĹśēįŤįÉÁĒ®ÁõĎśĶčšŅ°śĀĮÁöĄŤĺďŚáļŤ∑ĮŚĺĄ,ŚŹĮšĽ•Ťá™ŚģöšĻČ
xdebug.trace_output_dir = "E:\PHP\phpstudy_pro\tmp\xdebug"
;ÁĒüśąźÁöĄśēąŤÉĹÁõĎśĶčśĖᚼ∂ÁöĄŚźćÁßį
xdebug.profiler_output_name = "cache.out.%t-%s"
;ŤŅúÁ®čŚľÄŚźĮ 1 Ť°®Á§ļťĽėŤģ§ŤŅúÁ®čŚľÄŚźĮ 0 Ť°®Á§ļŚÖ≥ťó≠
xdebug.remote_enable = 1
xdebug.remote_handler = dbgp
;ŤŅúÁ®čšłĽśúļŚúįŚĚÄ ŤŅôťáĆŤģĺÁĹģÁöĄśėĮśąĎšĽ¨śú¨ŚúįŤß£śěźÁöĄŚüüŚźć
xdebug.remote_host = www.demo.com
;ŤŅúÁ®čŤá™Śä®ŚźĮŚä® 1 Ť°®Á§ļŚľÄŚßč 0 Ť°®Á§ļŚÖ≥ťó≠
xdebug.remote_autostart = 1
;ŤŅúÁ®čÁęĮŚŹ£ ŚŹĮŤá™Ś∑ĪŚģöšĻČ
xdebug.remote_port = 9100
xdebug.idekey = PHPSTORM2ԾȜČÄphpStormŤĹĮšĽ∂ԾƍģĺÁĹģXdebugÁęĮŚŹ£„ÄāťÄČśč© ‚ÄúFile‚ÄĚ -----> ‚ÄúSettings‚ÄĚ ŚĎĹšĽ§ÔľĆśČĂÄúSetting‚ÄĚŚĮĻŤĮĚś°ÜԾƝÄČśč© ‚ÄúLanguages & Frameworks‚ÄĚ -----> ‚ÄúPHP‚ÄĚ ----->‚ÄúDebug‚ÄĚ ťÄČť°ĻԾƌ¶āšłčŚõĺśČÄÁ§ļԾƌįÜÁęĮŚŹ£šŅģśĒĻšłļ9100ÔľąŚíĆšłäťĚĘ php.ini šł≠ťÖćÁĹģÁöĄxdebug.remote_port = 9100 šŅĚśĆĀšłÄŤáīŚć≥ŚŹĮÔľČÔľĆÁĄ∂ŚźéŚćēŚáĽ‚ÄúApply‚ÄĚśĆČťíģ„Äā
3ԾȝÖćÁĹģDBGp Proxy„ÄāŚú® ‚ÄúSettings‚ÄĚ ŚĮĻŤĮĚś°Üšł≠ԾƝÄČśč© ‚ÄúPHP‚ÄĚ ----> ‚ÄúDebug‚ÄĚ ----> ‚ÄúDBGp Proxy‚ÄĚ ťÄČť°ĻԾƌú®ŚĮĻŤĮĚś°Üšł≠Ś°ęŚÜô ‚ÄúIDE Key‚ÄĚ ÔľąŚíĆxdebug.idekey=PHPSTORMšŅĚśĆĀšłÄŤáīԾȌíĆ ‚ÄúHost‚ÄĚ ÔľąŚíĆxdebug.remote_host = www.demo.com šŅĚśĆĀšłÄŤáīÔľČԾƂÄúPort‚ÄĚ ťĽėŤģ§šłļ9001ŚŹĮšĽ•šłćšŅģśĒĻԾƌćēŚáĽ"Apply" śĆČťíģ.
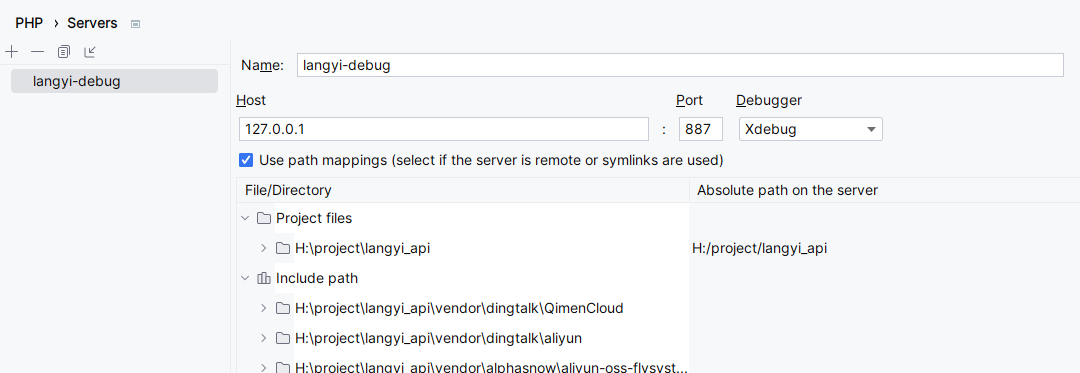
4ԾȝÖćÁĹģServers„ÄāŚú® ‚ÄúSettings‚ÄĚ ŚĮĻŤĮĚś°Üšł≠ԾƝÄČśč© ‚ÄúPHP‚ÄĚ ----> ‚ÄúServers‚ÄĚ ťÄČť°ĻԾƌąõŚĽļśú¨ŚúįŤįÉŤĮēśúćŚä°Śô®ÔľĆÁāĻŚáĽŚļĒÁĒ®Ść≥ŚŹĮ„ÄāśďćšĹúś≠•ť™§Ś¶āšłčÔľö
5ԾȝÖćÁĹģśĶčŤĮēť°ĻÁõģ„ÄāťÄČśč© ‚ÄúRun‚ÄĚ ----> ‚Äú Edit Configurations‚ÄĚ ŚĎĹšĽ§ÔľĆśĖįŚĽļšłÄšł™ŤŅźŤ°ĆŤįÉŤĮēťÖćÁĹģ„ÄāśďćšĹúś≠•ť™§Ś¶āšłčÔľö
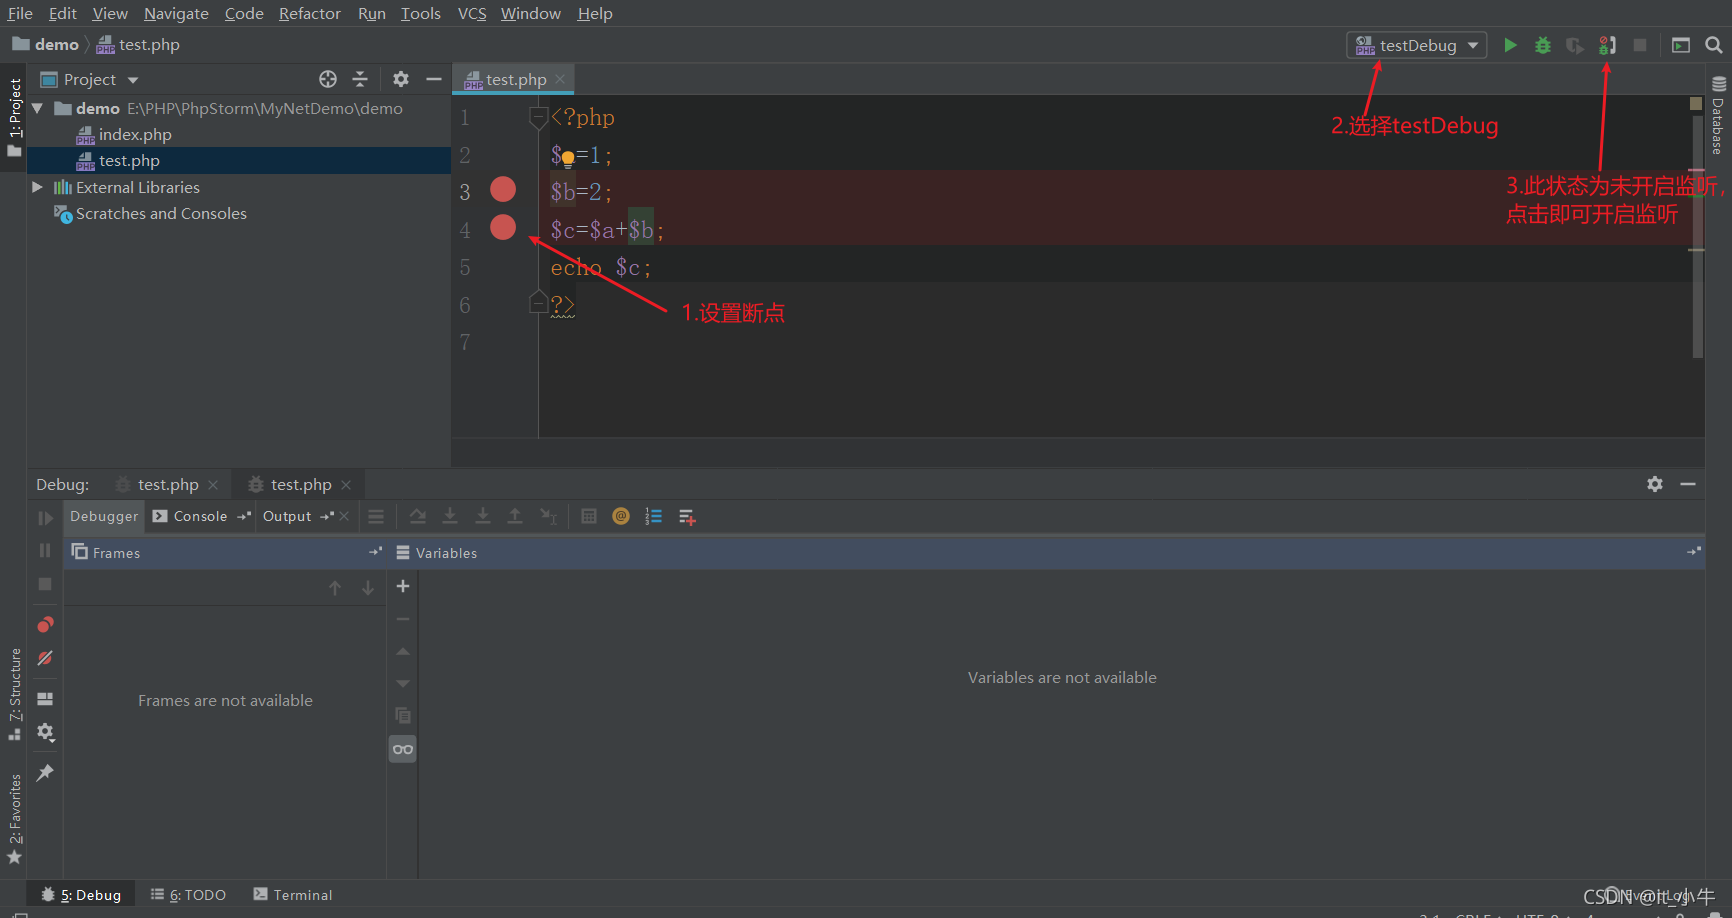
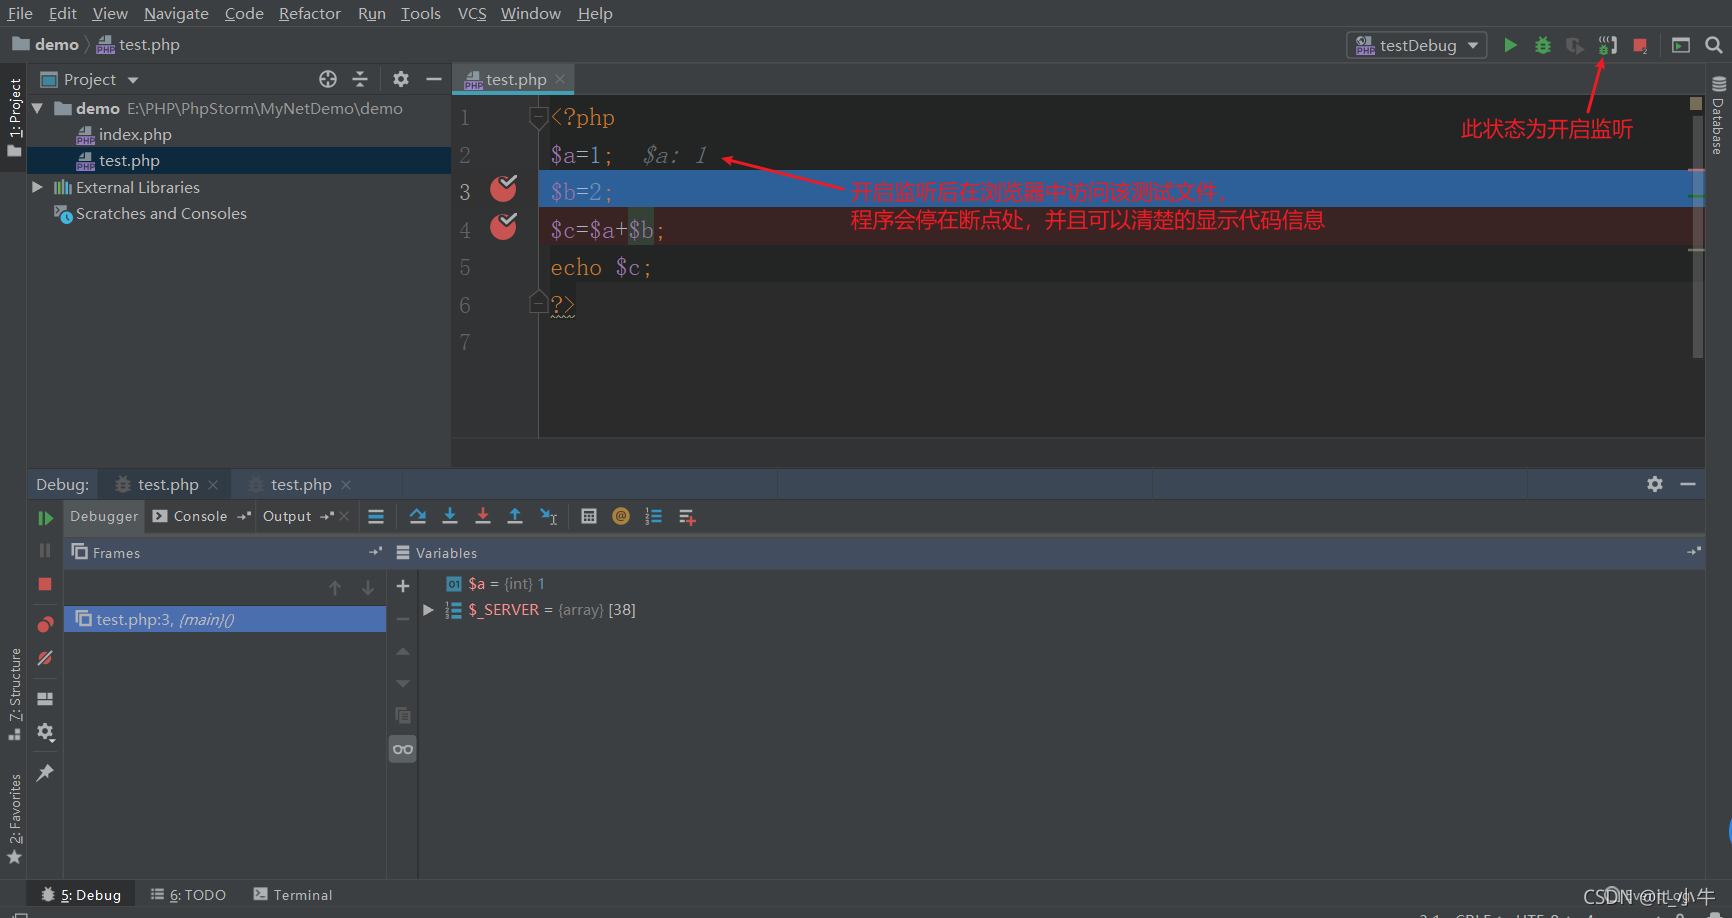
6ԾȜĖ≠ÁāĻśĶčŤĮē„ÄāŚú®ť°ĻÁõģšł≠śĖįŚĽļšłÄšł™Śźćšłļ‚Äútest.php‚ÄĚÁöĄśĖᚼ∂ԾƌćēŚáĽšĽ£Á†ĀŤßÜŚõ印ƌŹ∑ÁöĄšĹćÁĹģśĖįŚĘ욳Ěł™śĖ≠ÁāĻ„ÄāŚú®Á™óŚŹ£ŚŹ≥šłäŤßíťÄČśč© ‚ÄútestDebug" ÁöĄŤįÉŤĮēťÖćÁĹģԾƌćēŚáĽ ‚ÄúStart | Stop Listening for PHP Debug Connections‚ÄĚ śĆČťíģԾƌ¶āšłčŚõĺśČÄÁ§ļÔľö
ťÖćÁĹģÔľö
xdebug3
[xdebug]
zend_extension="<path to xdebug extension>"
xdebug.mode=debug
xdebug.client_host=127.0.0.1
xdebug.client_port="<the port (9003 by default) to which Xdebug connects>"
xdebug2
[xdebug]
zend_extension="<path to xdebug extension>"
xdebug.remote_enable=1
xdebug.remote_host=127.0.0.1
xdebug.remote_port="<the port (9000 by default) to which Xdebug connects>"
Configure Xdebug
Download XdebugÔĽŅ
Download the Xdebug extension compatible with your PHP version and install it as described in the installation guide.
Xdebug 3 brings performance improvements, simplified configuration, and PHP 8 support. To learn more on upgrading to Xdebug 3, see the Upgrade guide.
If you are using an AMP package, the Xdebug extension may be already installed. Refer to the instructions specific for your package.
Integrate Xdebug with the PHP interpreterÔĽŅ
Open the active php.ini file in the editor:
- In the Settings dialog (Ctrl+Alt+S), click PHP.
- On the PHP page that opens, click
next to the CLI Interpreter field.
- In the CLI Interpreters dialog that opens, the Configuration file read-only field shows the path to the active php.ini file. Click Open in Editor.
To disable the Zend Debugger and Zend Optimizer tools, which block Xdebug, remove or comment out the following lines in the php.ini file:
zend_extension=<path_to_zend_debugger>
zend_extension=<path_to_zend_optimizer>
- To enable Xdebug, locate or create the
[xdebug]section in the php.ini file and update it as follows:
Xdebug 3
[xdebug]
zend_extension="<path to xdebug extension>"
xdebug.mode=debug
xdebug.client_host=127.0.0.1
xdebug.client_port="<the port (9003 by default) to which Xdebug connects>"
Xdebug 2
[xdebug]
zend_extension="<path to xdebug extension>"
xdebug.remote_enable=1
xdebug.remote_host=127.0.0.1
xdebug.remote_port="<the port (9000 by default) to which Xdebug connects>"
In PHP 5.3 and later, you need to use only
zend_extension, notzend_extension_ts,zend_extension_debug, orextension.
To enable multi-user debugging via Xdebug proxies, locate the xdebug.idekey setting and assign it a value of your choice. This value will be used to register your IDE on Xdebug proxy servers.
- Save and close the php.ini file.
Verify Xdebug installation by doing any of the following:
In the command line, run the following command:
php --version
The output should list Xdebug among the installed extensions:

Create a php file containing the following code:
<?php
phpinfo();
Open the file in the browser. The `phpinfo` output should contain the Xdebug section:

Configure Xdebug in PhpStormÔĽŅ
Check Xdebug installationÔĽŅ
- Press Ctrl+Alt+S to open the IDE settings and select PHP.
Check the Xdebug installation associated with the selected PHP interpreter:
- On the PHP page, choose the relevant PHP installation from the CLI Interpreter list and click
next to the field. The list shows all the PHP installations available in PhpStorm, see Configure local PHP interpreters and Configure remote PHP interpreters.
The CLI Interpreters dialog that opens shows the following:
- The version of the selected PHP installation.
The name and version of the debugging engine associated with the selected PHP installation (Xdebug or Zend Debugger). If no debugger is configured, PhpStorm shows the corresponding message:

Alternatively, open the Installation Wizard, paste the output of the
phpinfo(), and click Analyze my phpinfo() output. Learn more about checking the Xdebug installation in Validate the Configuration of a Debugging Engine.- On the PHP page, choose the relevant PHP installation from the CLI Interpreter list and click
Define Xdebug behaviourÔĽŅ
- In the IDE settings (Ctrl+Alt+S), select Debug under the PHP node to open the Debug page.
In the Xdebug area, specify the following settings:
Debug port: appoint the port through which the tool will communicate with PhpStorm.
This must be the same port number as specified in the php.ini file:
 Xdebug 3

 ```ini
 xdebug.client_port="<the port (9003 by default) to which Xdebug connects>"
 ```

 Xdebug 2

 ```ini
 xdebug.remote_port="<the port (9000 by default) to which Xdebug connects>"
 ```


 By default, Xdebug 2 listens on port **9000**. For [Xdebug 3](https://xdebug.org/announcements/2020-11-25), the default port has changed from **9000** to **9003**. You can specify several ports by separating them with a comma. By default, the Debug port value is set to **9001,9003** to have PhpStorm listen on both ports simultaneously.

 To have PhpStorm accept any incoming connections from Xdebug engine through the port specified in the Debug port field, select the Can accept external connections checkbox.
Force break at first line when no path mapping specified: the selected checkbox makes the debugger stop as soon as it reaches and opens a file that is not mapped to any file in the project on the Servers page. The debugger stops at the first line of this file and Examine/update variables shows the following error message: Cannot find a local copy of the file on server
and a link Click to set up mappings. Click the link to open the Resolve Path Mappings Problem dialog and map the problem file to its local copy. When this checkbox is cleared, the debugger does not stop upon reaching and opening an unmapped file, the file is just processed, and no error messages are displayed.
- Force break at first line when a script is outside the project: the selected checkbox makes the debugger stop at the first line as soon as it reaches and opens a file outside the current project. With this checkbox cleared, the debugger continues upon opening a file outside the current project.
- Enable return function value debugging (Xdebug 3.2+): the selected checkbox adds an extra debugging step for inspection of return values in functions that return them immediately without storing in intermediate variables.
In the External connections area, specify how you want PhpStorm to treat connections received from hosts and through ports that are not registered as deployment server configurations.
- Ignore external connections through unregistered server configurations: select this checkbox to have PhpStorm ignore connections received from hosts and through ports that are not registered as deployment server configurations. When this checkbox is selected, PhpStorm does not attempt to create a deployment server configuration automatically.
- Break at first line in PHP scripts: select this checkbox to have the debugger stop as soon as connection between it and PhpStorm is established (instead of running automatically until the first breakpoint is reached). Alternatively turn on the Run | Break at first line in PHP scripts option from the main menu.
- Max. simultaneous connections: use this spin box to limit the number of external connections that can be processed simultaneously.
By default, PhpStorm only listens for incoming IPv4 connections. To enable IPv6 support, you need to make adjustments in PhpStorm JVM options:
- Select Help | Edit Custom VM Options from the main menu.
- In the .vmoptions file that opens, delete the
-Djava.net.preferIPv4Stack=trueline.- Restart PhpStorm.
Configure Xdebug for using in the On-Demand modeÔĽŅ
PhpStorm supports the On-Demand mode, where you can disable Xdebug for your global PHP installation and have it enabled automatically on demand only when you are debugging your command-line scripts or when you need code coverage reports. This lets your command line scripts (including Composer and unit tests) run much faster.
Disable Xdebug for command-line scripts:
- In the Settings dialog (Ctrl+Alt+S), go to PHP.
- From the PHP executable list, choose the relevant PHP interpreter and click
next to it. In the CLI Interpreters dialog that opens, click the Open in Editor link next to the Configuration file:
file. Close all the dialogs and switch to the tab where the php.ini file is opened. In the php.ini file, find the
[xdebug]section and comment the following line in it by adding;in preposition:;[xdebug] ;zend_extension = "<path to xdebug extension>"
Open the CLI Interpreters dialog and click
next to the PHP executable field. PhpStorm informs you that debugger is not installed:

- To enable PhpStorm to activate Xdebug when it is necessary, specify the path to it in the Debugger extension field, in the Additional area. Type the path manually or click
and select the location in the dialog that opens.
Configure Xdebug for using in the Just-In-Time modeÔĽŅ
PhpStorm supports the use of Xdebug in the Just-In-Time (JIT) mode so it is not attached to your code all the time but connects to PhpStorm only when an error occurs or an exception is thrown. Depending on the Xdebug version used, this operation mode is toggled through the following settings:
- Xdebug 2 uses the xdebug .remote_mode setting, which has to be set to
jit. - Xdebug 3 uses the xdebug.start_upon_error setting, which has to be set to
yes.
The mode is available both for debugging command-line scripts and for web server debugging.
Depending on whether you are going to debug command-line scripts or use a Web server, use one of the scenarios below.
Command-line scriptsÔĽŅ
For debugging command-line scripts, specify the custom -dxdebug.remote_mode=jit (for Xdebug 2) or -dxdebug.start_upon_error=yes (for Xdebug 3) directive as an additional configuration option:
- Press Ctrl+Alt+S to open the IDE settings and select PHP.
- From the PHP executable list, choose the relevant PHP interpreter and click
next to it.
- In the CLI Interpreters dialog that opens, click
next to the Configuration options field in the Additional area.
- In the Configuration Options dialog that opens, click
to add a new entry.
Xdebug 3
Type xdebug.start_upon_error in the Configuration directive field and yes in the Value field.
Xdebug 2
Type xdebug.remote_mode in the Configuration directive field and jit in the Value field.
When you click OK, you return to the CLI Interpreters dialog where the Configuration options field shows -dxdebug.remote_mode=jit (for Xdebug 2) or -dxdebug.start_upon_error=yes (for Xdebug 3).
Web server debuggingÔĽŅ
- From the main menu, choose Run | Web Server Debug Validation.
In the Validate Remote Environment that opens, choose the Web server to validate the debugger on.
Choose Local Web Server or Shared Folder to check a debugger associated with a local Web server.
Path to Create Validation Script: In this field, specify the absolute path to the folder under the server document root where the validation script will be created. For Web servers of the type Inplace, the folder is under the project root.
The folder must be accessible through http.
- URL to Validation Script: In this field, type the URL address of the folder where the validation script will be created. If the project root is mapped to a folder accessible through http, you can specify the project root or any other folder under it.
Choose Remote Web Server to check a debugger associated with a remote server.
- Path to Create Validation Script: In this field, specify the absolute path to the folder under the server document root where the validation script will be created. The folder must be accessible through http.
Deployment Server: In this field, specify the server access configuration of the type Local Server or Remote Server to access the target environment. For details, see Configure synchronization with a server.
Choose a configuration from the list or click Browse
in the Deployment dialog.
- Click Validate to have PhpStorm create a validation script, deploy it to the target remote environment, and run it there.
- Open the php.ini file which is reported as loaded and associated with Xdebug.
- In the php.ini file, find the
[xdebug]section.
Xdebug 3
Change the value of the xdebug.start_upon_error from the default default to yes.
Xdebug 2
Change the value of the xdebug.remote_mode from the default req to jit.
See also Just-In-Time debugging and PHP Exception Breakpoints with PhpStorm and Xdebug
Configure Xdebug running in a Docker containerÔĽŅ
To configure Xdebug running in a Docker container, provide the Xdebug-specific parameters in the Dockerfile, for example:
Xdebug 3
RUN pecl install xdebug \
    && docker-php-ext-enable xdebug
    && echo "xdebug.mode=debug" >> /usr/local/etc/php/conf.d/docker-php-ext-xdebug.ini \
    && echo "xdebug.client_host = host.docker.internal" >>
/usr/local/etc/php/conf.d/docker-php-ext-xdebug.ini
Xdebug 2
RUN pecl install xdebug \
&& docker-php-ext-enable xdebug
&& echo "xdebug.remote_enable=on" >> /usr/local/etc/php/conf.d/docker-php-ext-xdebug.ini \
&& echo "xdebug.remote_host = host.docker.internal" >> /usr/local/etc/php/conf.d/docker-php-ext-xdebug.ini
In this example, we're modifying /usr/local/etc/php/conf.d/docker-php-ext-xdebug.ini providing the mode and client_host Xdebug parameters.
Note that the xdebug.client_host value should be replaced with the IP address of the machine where PhpStorm is running, which is accessible from the Docker container. If you are using Docker for Windows or Docker for Mac, you can set xdebug.client_host to host.docker.internal, which automatically resolves to the internal address of the host, letting you easily connect to it from the container.
Configure Xdebug running on a Vagrant instanceÔĽŅ
To configure Xdebug running on a Vagrant instance, connect to the Vagrant machine and provide the Xdebug-specific parameters in the php.ini file:
Xdebug 3
[xdebug]
zend_extension="<path to xdebug extension>"
xdebug.mode=debug
xdebug.client_host=10.0.2.2
xdebug.client_port=9003
Note that the xdebug.client_host value is 10.0.2.2. This is the gateway used in the default Vagrant setup, which allows connecting from the instance to host where PhpStorm is running.
Xdebug 2
[xdebug]
zend_extension="<path to xdebug extension>"
xdebug.remote_enable=1
xdebug.remote_host=10.0.2.2
xdebug.remote_port=9000
Note that the xdebug.remote_host value is 10.0.2.2. This is the gateway used in the default Vagrant setup, which allows connecting from the instance to host where PhpStorm is running.
Configure Xdebug running in a WSL instanceÔĽŅ
To configure Xdebug running in a WSL environment, connect to the WSL Linux installation and provide the Xdebug-specific parameters in the php.ini file:
Xdebug 3
[xdebug]
zend_extension="<path to xdebug extension>"
xdebug.mode=debug
xdebug.client_host=<WSL host IP>
xdebug.client_port=9003
Xdebug 2
[xdebug]
zend_extension="<path to xdebug extension>"
xdebug.remote_enable=1
xdebug.remote_host=<WSL host IP>
xdebug.remote_port=9000
Note that the xdebug.client_host value has to be set to the IP address of the WSL host machine. To obtain it, run the following command inside the WSL Linux installation:
cat /etc/resolv.confIf you use Docker Compose inside a WSL environment, do the following to obtain the correct WSL host IP address.
Connect to the WSL Linux installation and set an environment variable for the IP address of the WSL host machine in a
.bashrcor.zshrcfile.export IP=$(hostname -I)
Pass this environment variable to the
extra_hostsparameter for thephpservice in the docker-compose.yml file.services: php: extra_hosts: docker.for.wsl2.host.internal: ${IP}
